
Getting started
Every outbound call carried by Quality Voice & Data leaves a record behind: the number you dialed from, the number you dialed, the carrier that delivered it, the carrier's response code, whether it was answered, and more. Call Clarity turns those records into reports that show how your campaigns are performing and where to improve them.
There is nothing to install or connect on your side. If QVD carries the traffic, it is already here. Everything is scoped to your company: your traffic, on your numbers, for your campaigns — nobody else's.
The three questions Call Clarity answers
- What changed? Key Insights compares one rolling period with the period immediately before it.
- Where did it change? Metric Deep Dive and Top Contributors rank the states, area codes, numbers, campaigns, and carriers behind the average.
- What is driving it? Specialty reports go one level lower into call-length distributions, SIP failures, dial frequency, and per-number pacing.
Call Clarity loads once each morning and covers everything through the previous day. The Last updated timestamp in the dashboard header is definitive.
Signing in
Your QVD Account Manager will help your company name a Client Admin. That person creates and removes users and controls report access. Name a second Admin as a backup.
Sign-in uses two factors: your password, then a confirmation link we email you.
- Go to app.qualityvoicedata.com and enter your email address and password.
- Open the email we send and click the sign-in link to confirm it's you. The link expires after an hour and works only once.
- On your first sign-in, you'll be asked to replace the temporary password you were issued.
Once you're signed in, we'll remember your device for up to 24 hours.
Finding your way around
Two things to know. The Dashboards menu at the top right switches between every report in this guide. The admin panel sits at the foot of the dashboard pages — that's where Client Admins invite teammates and manage their access (section 8).
Supported devices
Call Clarity is built for desktop and laptop screens, and works on tablets. Expect degraded performance on a phone: charts and tables overflow the screen at that width.
Your first 10 minutes
- On the Analytics Dashboard, set Group by to Weekly and leave Campaign on all. Read the KPI cards for volume, contacts, seizures, ASR, contact rate, average call length, and DID utilization against the preceding period.
- Open Filters and change the Connected Call Threshold to 30 seconds. Watch how the results change when a conversation must last longer to count as a contact.
- Open Key Insights. In Top Contributors, group by Campaign, set a sensible minimum volume, and read Top Negative. That is your shortlist of the campaigns costing the most real performance.
Your dashboards
Start with the question, not the menu.
| If you're asking… | Go to |
|---|---|
| Are we connecting more or fewer calls than last week? | Key Insights — Weekly, all campaigns |
| Which campaign is dragging the average down? | Key Insights → Top Contributors, grouped by Campaign |
| Is one carrier failing our calls? | SIP Errors, or Analytics segmented by Carrier |
| Which states or area codes underperform? | Metric Deep Dive, grouped by State or Area Code |
| Which individual numbers should we retire? | DID Deep Dive, or Metric Deep Dive grouped by CLI |
| Are we calling the same people too often? | OverDial |
| Did average call length drop because of short calls or fewer long ones? | ALOC Percentiles |
| Are we pushing volume through only a handful of numbers? | Velocity, plus DID utilization in Key Insights |
| Do we have enough local numbers for the list we're dialing? | Key Insights match rates, plus Metric Deep Dive grouped by State |
| How has one metric moved over the last quarter? | Analytics Dashboard — choose the date range and group by Week |
| Can I put these numbers in a spreadsheet? | Export CSV on Analytics or Metric Deep Dive |
Three dashboards and five specialty reports, each answering a different kind of question. Key Insights covers the routine weekly or monthly review; the rest answer something more specific. The five specialty reports all sit behind the Specialty Reports entry in the Dashboards menu.
| Dashboard | What it does | Reach for it when… |
|---|---|---|
| Analytics Dashboard | One metric charted over time, with filters and segment breakdowns. | You want to see a trend, compare segments, or pull a filtered CSV. |
| Key Insights | A scorecard of every headline metric for a rolling period, versus the period before it, plus what moved the number. | You're running a weekly or monthly review and want the whole picture on one screen. |
| Metric Deep Dive | One metric ranked across every state, area code, or outbound number. | You suspect the problem is geographic or sits with specific numbers. |
| OverDialSpecialty | Dials per called number over your chosen window, with the numbers and campaigns you dial hardest. | You need to check contact frequency, or suspect a list is being over-worked. |
| ALOC PercentilesSpecialty | The full distribution of answered call lengths, from the 10th to the 99th percentile. | Your average call length moved and you need to know which end of the distribution caused it. |
| SIP ErrorsSpecialty | SIP response code breakdown by carrier, campaign, and number. | Calls are failing and you need to know whether it's a carrier problem. |
| DID Deep DiveSpecialty | Per-number performance against the campaign average. | You want to find and retire the individual numbers that are underperforming. |
| VelocitySpecialty | Per-number pacing and burst behaviour across a 7-day window. | You want to confirm volume is spread across your inventory rather than concentrated. |
A Metric Definitions page is linked from the ⓘ icon next to the metric selector on the Analytics Dashboard, and repeats what's in section 7 of this guide.
Analytics Dashboard
The Analytics Dashboard plots a single metric over a date range you choose. Everything starts in the control bar across the top.
Control bar
- Metric — Call Volume, Connected Calls, Seizure Rate (ASR) %, Contact Rate %, or Avg. Call Length (ALOC). This drives the chart, the table, and the Strategic Insights section beneath.
- Date range — a start and end date.
- Group by — Day, Week, Month, or Quarter. Weeks start Monday; quarters follow the calendar year.
- Ignore Incomplete — hides periods that haven't finished yet, so a part-week or part-month doesn't look like a collapse in volume. Turn this on for any weekly or monthly view.
- Submit — re-runs the query. Changing a control doesn't reload the page on its own.
Filters and segmentation
The Filter button opens a drawer with three columns. Anything you apply shows as a chip in the Active Filters bar, and Clear All resets it.
- Business filters — Campaign (select several at once) and the Connected Call Threshold, which sets how long a call must last to count as a contact: 6, 12, 30, or 60 seconds. Raising it strips out machine answers and short drops.
- Technical filters — Carrier, BCID, M&R, Dial Type, and Business Type (B2C or B2B).
- Segment by — split the chart into a series per Carrier, Campaign, BCID, M&R, Dial Type, or Business Type, keeping the top N segments. For rate metrics, Advanced Options adds a minimum call volume; segments below it are pooled into “Other” so a 3-call segment with a 100% rate can't distort the picture.
Reading the results
The left rail carries seven KPI cards — Total Volume, Total Contacts, Total Seizures, ASR, Contact Rate, Avg. Call Length, and DID Utilization — each showing the change against the preceding period of equal length and a sparkline of its recent shape. DID Utilization loads a moment after the rest; that's expected.
The chart supports drag-to-zoom, with a Reset Zoom button once you're in. Below it, Detailed Data holds the underlying numbers (Show All Rows expands it) with Export CSV alongside — the export honours every filter currently applied. Last comes Strategic Insights, which ranks your segments on the metric you selected.
Date ranges that reach back more than about 100 days are served from cold storage and can take up to a minute to return. Narrow the range if you just need recent activity.
Key Insights
Key Insights is the review page: one rolling period, compared against the period immediately before it, with an explanation of what moved.
The masthead always states the period, the campaign scope, and the as-of date, so a screenshot records exactly which window it came from.
Setting the window
Open Filters at the top right:
- Campaign — one, several, or all.
- As-Of — the last day included. Everything is measured backwards from here.
- Period — Daily (1 day), Weekly (7), Biweekly (14), Monthly (30), or Custom for any day count up to 365.
These are rolling windows, not calendar ones: a Monthly report as of the 18th covers the 30 days ending the 18th, and compares against the 30 days before that.
Scorecards and trend
The scorecard strip carries Call Volume, Contact Rate, Seizure Rate (ASR), Area Code Match, State Match, ALOC, and DIDs Used, each with its change versus the prior period. Click any card to redraw the chart below it as that metric's last six periods.
Top Contributors
This is the section that answers “why”. For Contact Rate, Match Rate, ALOC, and Call Volume, it ranks your segments by impact:
Impact = Call Volume × (Segment Metric − Overall Average)
Impact weights a segment's gap from your average by how much traffic ran through it. A state that's 8 points below average on 40,000 calls outranks one that's 30 points below on 200 — it's costing you far more conversations. Each block can be grouped by State, Area Code, Phone Number, Campaign, or Carrier.
- Top Negative / Top Positive — what's dragging you down, or what's working and worth copying.
- Min volume — suppress thin segments.
- Compare vs prior period — adds the previous period's value to each row, so you can tell a chronic problem from a new one.
DID utilization
The last block, and the overview cards beneath it, cover your numbers: how many were provisioned, how many actually placed calls, and the resulting utilization — broken out by State, Area Code, Phone Number, and Campaign, alongside call volume, contact rate, and match rate for each. Low utilization means you're paying for inventory you aren't rotating through.
Metric Deep Dive
Where Key Insights tells you a metric moved, Metric Deep Dive shows you its full distribution.
Pick one metric and see it across every state, every area code, or every outbound number you dial from.
- Group by — State, Area Code, or CLI (the individual outbound number).
- Metric — Call Volume, ALOC, Match Rate, Contact Rate at 6s / 12s / 30s, DID Utilization, Calls per DID, or Total DIDs.
- Sort by — any of those metrics, ascending or descending. Sort and display metric are independent: rank by call volume, colour by contact rate.
- Period — Weekly (7 days) or Monthly (30 days), rolling back from the As-Of date.
Narrowing the table
Metric Filters sets a minimum and maximum on any metric, and they stack — “area codes with at least 500 calls and a contact rate under 4%” is two filters. A badge counts what's active, and Clear all resets them.
Histogram
Show Histogram opens the distribution of the current metric. Click any bar to filter the table down to the rows in that range — the fastest way to get from “our ALOC dropped” to the exact list of numbers responsible. Export CSV exports whatever the table currently shows.
Specialty Reports
Five focused tools, each with its own filter bar. Choose a client scope, campaigns, and a window, then press Run Report.
None of them load automatically, because several scan a lot of history.
OverDial how often you're calling the same person
Counts dials per called number over the last 7, 30, 90, or 180 days and shows the distribution — how many numbers you dialled once, twice, twenty times. It also surfaces your heaviest-dialled numbers and campaigns, with first and last contact dates. The contact frequency table buckets numbers by dial count and reports the share of your calls that went to numbers reached 7 or more times in a 7-day window, which is the threshold we flag for contact-frequency review. Use it to spot list exhaustion and dialer misconfiguration before it becomes a complaint.
ALOC Percentiles the shape of your call lengths
An average on its own can mislead: a 45-second average can be all 45-second calls, or a mix of 5-second hangups and 4-minute conversations. This report gives you the distribution of answered call lengths — mean plus the 10th, 25th, 50th, 75th, 90th, 95th, and 99th percentiles, a bucketed histogram, and a trend line, over 7, 30, or 90 days. A median well below the mean means most calls end early.
SIP Errors why calls failed
Breaks down SIP response codes over 7-, 30-, and 90-day windows, with calls, connections, and seizures for each — split by carrier and by campaign, and drillable to the individual number. Elevated failures concentrated on one carrier point at a delivery problem rather than anything about your list.
DID Deep Dive performance number by number
One row per outbound number over 7, 30, or 90 days: total calls, seizures, seizure rate, contact rate at 6 and 30 seconds, and ALOC — each compared against the campaign average, so underperforming numbers stand out immediately.
Velocity bursts and pacing
Examines a single client's numbers over a 7-day window ending on a date you choose, and reports per-number throughput for any number placing more than five calls. It answers whether volume is spread evenly across your inventory or concentrated in short bursts on a handful of numbers, which is the pattern most likely to draw carrier attention.
Playbooks
Five repeatable routines that end with something your team can act on, not another chart.
The weekly review 15 minutes, same day each week
- Open Key Insights. Set Period to Weekly and Campaign to all, then read the scorecard against the prior week.
- Open the two metrics that moved most and check their six-period trend. One bad week and a four-week slide need different responses.
- In Top Contributors, group by Campaign and set a minimum volume. Read Top Negative, then Top Positive.
- For the metric that moved, switch the grouping to State or Carrier and note whether the same names keep appearing.
- Write down one thing to change and one thing to watch. Screenshot the masthead so next week's review uses the same scope.
A campaign in Top Negative three weeks running is often a structural problem, not random variance.
Contact rate dropped
- Confirm the period is complete and the connected-call threshold is the same in both views.
- In Top Contributors for Contact Rate, group by Campaign, then State, then Carrier, with prior-period comparison on.
- If one campaign owns the drop, inspect its list and dialing strategy. If the drop spans campaigns but clusters geographically, inspect match rate and DID coverage.
- In Metric Deep Dive, group by Area Code, sort ascending, set a minimum volume, and export the lowest histogram bucket.
If ASR held while contact rate fell, calls are still being answered but people are hanging up faster. Check the list, caller ID, and opening.
Calls aren't connecting
- In Analytics, chart Seizure Rate (ASR) by Day and segment by Carrier. Look for one carrier diverging from the others.
- Open SIP Errors for 7 days and compare the carrier's code mix with the 30-day view.
- Drill the affected carrier to campaign and then individual numbers. If failures sit with specific numbers, compare them in DID Deep Dive.
Failures spread across carriers and numbers usually point to the list. One carrier points to delivery; a handful of your numbers points to DID performance.
Are we over-working the list?
- Run OverDial for 30 days across all campaigns and read the contact-frequency distribution.
- Check the share of calls going to numbers reached seven or more times in a 7-day window.
- Review the heaviest-dialed numbers and their first and last contact dates, then compare those campaigns with contact rate in Key Insights.
A small share of numbers absorbing a large share of dials — volume you could be spending on people you have never reached.
Are our numbers earning their keep?
- In Key Insights, compare DIDs provisioned with DIDs used. Persistent low utilization means inventory is sitting idle.
- Use Metric Deep Dive by CLI with Calls per DID, then Velocity, to see whether volume is concentrated or bursty.
- Use DID Deep Dive to rank numbers against the campaign average. Retire persistent laggards only after they have enough volume.
- Cross-check match rate by State. Low match rate plus idle inventory often means the pool covers the wrong geography.
Idle inventory is a cost problem; concentrated inventory is a risk problem. Treat them separately.
Metric definitions
These definitions are identical everywhere in Call Clarity. Where a metric depends on a threshold or a window, that's noted.
Core call metrics
| Metric | Formula | What it means |
|---|---|---|
| Call Volume | Total calls | Every call attempt, including inbound calls on PBX accounts and 0-second failures. The raw dial count. |
| Connected Calls (Seizures) | Calls answered by a person or a machine | The far end picked up. Voicemail and automated attendants count. |
| Seizure Rate (ASR) | Connected ÷ Total calls × 100 | Share of attempts that connected. The headline measure of call delivery quality. Known in telecom as Answer Seizure Ratio. |
| Contact Rate | Connected calls longer than the threshold ÷ Total calls × 100 | Share of attempts that became a real conversation. Default threshold is 6 seconds; 12, 30, and 60 are selectable. Higher thresholds strip out machine answers. |
| ALOC | Total answered call duration ÷ Connected calls | Average length of an answered call, in seconds. Shown as minutes and seconds (1m 42s). |
| Talk Minutes (MOU) | Total call length ÷ 60 | Actual usage minutes, not billed minutes. Internal employee-to-employee calls are excluded. |
| Avg. Daily Volume | Total calls ÷ Days in range | Lets you compare periods of different lengths fairly. |
Local presence and number metrics
| Metric | Formula | What it means |
|---|---|---|
| Match Rate | Calls where the caller ID area code matched the called party's ÷ Total calls × 100 | How often you presented a local number. A low match rate usually means your DID inventory doesn't cover the geography of your list. |
| State Match Rate | Calls where caller and called states matched ÷ Total calls × 100 | The same idea at state level — a looser but broader measure of local presence. |
| DIDs Provisioned | Distinct numbers assigned to you in the window | The size of your outbound number pool. |
| DIDs Used | Distinct numbers that placed at least one call | How much of that pool you actually put to work. |
| DID Utilization | DIDs Used ÷ DIDs Provisioned × 100 | Coverage of your inventory. Persistently low utilization means you're paying for numbers that sit idle. |
| Calls per DID | Total calls ÷ DIDs used | How hard each working number is being pushed. High values mean your volume is concentrated on a small share of your inventory. |
| Impact | Call Volume × (Segment Metric − Overall Average) | Used to rank contributors in Key Insights. Weights how far a segment sits from your average by how much traffic ran through it. |
Fields you can filter and segment by
| Field | Definition |
|---|---|
| Campaign | Your department or outreach program. The main way calls are grouped into business units. |
| Carrier | The called party's phone carrier — AT&T, T-Mobile, Verizon, or Other. Useful for isolating carrier-specific delivery problems. |
| Dial Type | How the call was placed: Manual Dial, Click to Dial, Power Dial, or Predictive Dial. |
| Business Type | B2C or B2B. |
| SIP / PBX | Whether the call ran over a SIP trunk or a hosted PBX account. |
| BCID | Whether the call carried Branded Caller ID. |
| M&R | Whether the call was part of a Managed Number Rotation program. |
| State / Area Code | Geography of the number, used for grouping in Metric Deep Dive and Key Insights. |
| CLI / DID | An individual outbound number. |
Users & permissions
If you're a Client Admin, you manage your own team's access.
Everything below happens under Users, reachable from the admin links at the foot of the dashboard pages.
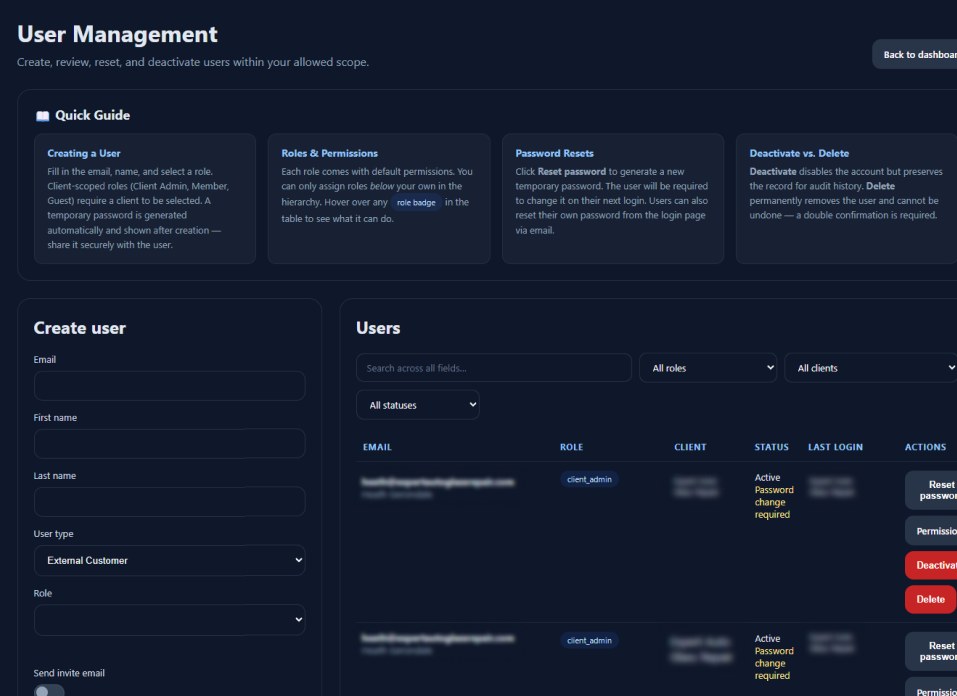
Roles
| Role | Gets by default | Manage users |
|---|---|---|
| Client Admin | All dashboards, CSV export, and the ability to add and manage users and permissions inside your company. | Yes |
| Client Member | All dashboards and CSV export. | No |
| Client Guest | Nothing by default — you grant access page by page. Use this for auditors, contractors, or anyone who should see one report and no more. | No |
Adding someone
- Open Users and add a user: email address, first and last name, and a role.
- Tick Send invite to have Call Clarity email them a welcome message with their temporary password. Leave it unticked and the temporary password is shown to you once, to pass on yourself.
- They sign in with that temporary password and are required to set their own before reaching a dashboard.
You can only create users inside your own company, and you can only assign roles at or below your own — a Client Admin can create Members and Guests, not other Admins.
Changing and removing access
- Edit — change a name or role, or unlock an account locked by failed sign-ins.
- Reset password — issues a new temporary password, which the user must change at next sign-in.
- Deactivate — the account stays on file but can no longer sign in. This is the right move when someone leaves; deletion is permanent.
Fine-grained permissions
Roles are a starting point. The Permissions page grants or revokes individual capabilities on top of a role — the usual reason to use it is to give a Guest exactly one dashboard, or to take CSV export away from a specific person.
| Permission | Grants access to |
|---|---|
| View dashboard | The Analytics Dashboard. |
| View insights | Key Insights. |
| View metric deep dive | Metric Deep Dive. |
| View specialty reports | All five Specialty Reports. |
| Export CSV | The export buttons on dashboards and reports. |
| View get data | The raw data download section, where enabled for your account. |
| Manage users | Creating, editing, deactivating, and resetting users in your company. |
| Manage permissions | Granting and revoking these permissions for your users. |
Sign-ins, user creation, role changes, password resets, and permission grants are all recorded with the account that made the change and the time it happened. Ask us any time you need a record for a security review.
Data, refresh & support
The dashboard header's Last updated timestamp is the definitive answer for the data in front of you.
| Topic | What to expect |
|---|---|
| Refresh | Once a day, in the early morning — around 5:00 AM Central. If source data is late, the pipeline waits and retries instead of loading a partial day. |
| Coverage | Everything through the previous day. Today's traffic appears in tomorrow morning's run. |
| Speed | Ranges reaching back more than roughly 100 days come from cold storage and can take up to a minute. Shorter ranges return faster. |
| History | Well beyond a year for most accounts. Set a wide range in Analytics to see where your available series begins. |
Questions we get asked
How often does the data refresh?
Once a day, in the early morning — around 5:00 AM Central. The Last updated timestamp in the dashboard header is always the definitive answer for the data you're looking at right now.
Why can't I see today's calls?
The daily refresh loads everything through the previous day. Today's traffic appears in tomorrow morning's run.
The refresh looks late. What now?
If the source data isn't ready when the refresh starts, the pipeline waits and retries on its own rather than loading a partial day — so a late timestamp usually resolves without anyone doing anything. If it's still stale by mid-morning, let us know.
Why does the current week or month look so low?
Because it isn't finished. Turn on Ignore Incomplete on the Analytics Dashboard to drop partial periods from the chart.
Why is this query taking so long?
Ranges reaching back more than roughly 100 days are read from cold storage and can take up to a minute. A shorter range returns immediately.
What's the difference between ASR and Contact Rate?
ASR counts anything that answered, including voicemail. Contact Rate only counts answered calls that lasted past your threshold — 6 seconds by default. ASR measures delivery; Contact Rate measures conversations.
Two dashboards show different numbers for the same metric. Why?
Almost always the window. Key Insights and Metric Deep Dive use rolling windows ending on an as-of date; the Analytics Dashboard uses the calendar range you typed. Check the connected-call threshold too — a Contact Rate at 6 seconds and one at 30 are different measurements.
Can I get the underlying numbers out?
Yes — Export CSV on the Analytics Dashboard and Metric Deep Dive exports exactly what your current filters produced, if your account has export permission.
How far back does the history go?
Well beyond a year for most accounts. The simplest test is to set a wide date range on the Analytics Dashboard and see where the series begins.
My sign-in link expired.
Links last one hour and work once. Sign in again and a fresh one is emailed. If it isn't arriving, check spam, then ask us to confirm the address on file.
I'm locked out.
Five failed attempts lock an account for 15 minutes. A Client Admin at your company can unlock it immediately from the Users page, or you can wait.
Can another customer see our data?
No. Access is scoped to your company on the server, on every page and every export.
Something looks wrong in the data.
Send us the dashboard, the filters, and the date range — ideally a screenshot, since the Key Insights masthead records the period and as-of date. That's usually enough for us to reproduce it straight away.
Getting help
- Phone
- (888) 656-5111
- Book time
- Meet with us